Dashboard Overview
What the Dashboard Shows
GCXONE is a cloud-based, AI-powered monitoring and operations platform delivering unified video surveillance and IoT services as a Security Management SaaS. It enables centralized remote monitoring without local infrastructure — a single intelligent interface for alarms, device health, dashboards, workflows, and AI tools.
- AI-Powered — NOVA99x filters up to 99% of false alarms before any alarm reaches an operator.
- Cloud-Native SaaS — No local infrastructure. Fully multi-tenant with strict data isolation per organization.
- Role-Aware — Every user sees only assigned modules, entities, and dashboards — enforced by RBAC.
- Built to Scale — Onboard hundreds of sites with BulkImport. Grow operations without proportional headcount.
- Talos Integration — Works hand-in-hand with Evalink Talos as the operator workflow layer for alarm handling.
- Device Health — HealthCheck continuously monitors every camera for offline, obstructed, or degraded states.
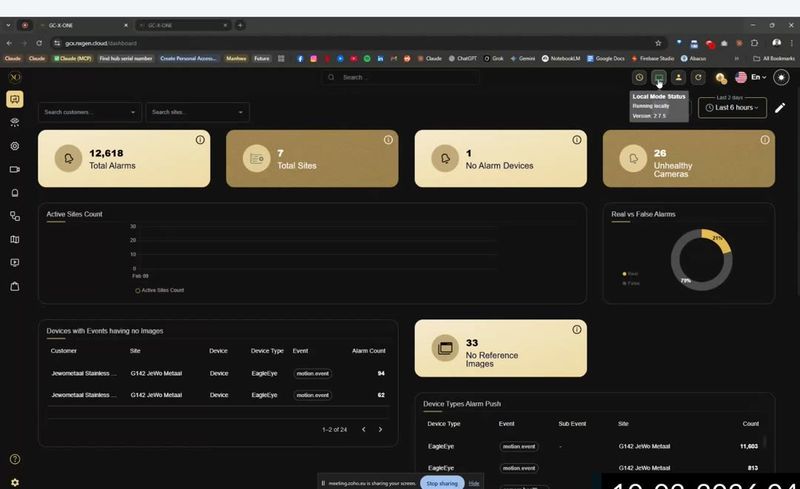
Four KPI cards are displayed at the top of the Dashboard for the selected time period (default: last 2 days):
- Total Alarms — The total number of alarm events generated across all monitored sites.
- Total Sites — The number of sites currently configured under your service provider account.
- No Alarm Devices — Devices active but without alarms in the period. A high count may indicate connection or sensor issues.
- Unhealthy Cameras — Cameras that failed their last HealthCheck. Directly linked to the HealthCheck module.
Why It Matters
The Dashboard is your single intelligent interface for monitoring alarms, device health, and operational workflows across all sites — without needing local infrastructure.
How It Works
Every alarm follows a strictly structured, traceable 5-step lifecycle:
- Devices & Cameras — Sensors detect events and send signals to GCXONE.
- NOVA99x AI Filter — AI pipeline evaluates the event in real time; false alarms are discarded before reaching an operator.
- Verified → Talos — Confirmed alarms are forwarded via DC-09 or Talos REST to the Central Monitoring Station.
- Operator Review — CMS operator receives the alarm with pre-event footage, live feed, and AI bounding box overlays.
- Resolved + Audit — Outcome is logged with a cryptographically sealed, immutable audit trail.
Multi-Tenant Entity Hierarchy
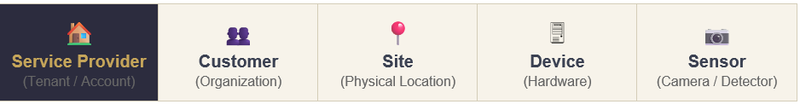
Every object you manage in GCXONE fits into a five-level hierarchy. Understanding this structure is essential before configuring access or routing alarms.
- Service Provider (Tenant) — Root level. Global fleet operations, macro SLA reporting, multi-site role governance.
- Customer (Organization) — Discrete client groups with segmented dashboards and billing logic.
- Site (Physical Location) — Tangible geo-fences with incident mapping and local operators.
- Device (NVR / Bridge / AI Box) — Connectivity boundary with streaming configuration and device health monitoring.
- Sensor (Camera / Detector) — Finest data granularity — individual rule application vector.
TIP — Cascading Inheritance: Entity trees cascade natively. Selecting an entire Customer automatically grants access to all sub-Sites, Devices, and Sensors beneath it. Vital to understand when structuring access maps for senior admins vs. site-only guard roles.
Key Capabilities
Dashboard Charts
- Active Sites Count — Line chart showing how many sites were actively transmitting data during the selected period.
- Real vs. False Alarms — Donut chart showing the ratio of confirmed real alarms to false alarms filtered by the platform. In a typical deployment, 75–80% of events are automatically filtered.
- Devices with Events without Images — Table of devices that triggered events but did not attach an image. Indicates cameras requiring calibration using reference images or a review of streaming configuration.
- Device Types Alarm Push — Breakdown of alarm frequency by device type and event type. Helps identify which integrations are causing the most false alarms.
Left Navigation Sidebar
- Dashboard — KPI overview page.
- Alarms — Alarm event queue and Talos workflow management.
- Sites — Overview and status at the site level.
- Device Explorer — Live video viewer with hierarchical site/camera structure.
- Map — Satellite view with camera and sensor positioning.
- Reports — HealthCheck and other reporting modules.
- Configuration — Admin settings for customers, sites, devices, and sensors.
- Settings (gear icon) — Roles, users, tags, and account settings.
Top Bar Controls
- Search — Global search across all entities. Keyboard shortcut: Ctrl+K.
- Local Mode Status — Shows whether you're in cloud mode or local fallback mode.
- Time Range Filter — Adjusts the time window for all Dashboard metrics.
- Language Selection — Switches the UI language.
GCXONE vs. Evalink Talos
- GCXONE side: Ingests real-time streams from connected fleets. Runs NOVA99x AI pipelines to reject false alarms. Empowers operators with live video and playback. Handles deep configuration across entity hierarchies.
- Evalink Talos side: Receives scrubbed, verified alarm signals from GCXONE. Acts as the tactical command layer for operator queues. Initiates rapid escalation chains and SLA rules. Enforces "Next Steps" flow charts for crisis resolution.
Real-World Use Cases
- A service provider monitors hundreds of sites from a single Dashboard without visiting any location.
- An operator sees a spike in Unhealthy Cameras and immediately routes a technician for calibration.
- A manager uses the Real vs. False Alarms donut chart to verify that NOVA99x is filtering correctly during a high-traffic period.
Best Practices
- Always check the Unhealthy Cameras KPI at the start of every shift.
- Use Devices with Events without Images regularly to catch cameras that need recalibration.
- Set the Time Range Filter to match your reporting period before reviewing KPI cards.
- Use Ctrl+K for fast entity lookup instead of navigating manually.
Additional Details
Navigating to Settings
Click the gear icon at the bottom of the left navigation sidebar. Under Settings you can manage:
- General — Organization-level settings.
- User Profile — Your personal account details.
- Roles — Define and configure role-based access.
- Users — Invite and manage user accounts.
- Reports — Settings for scheduled and on-demand reports.
- Tag Management — Manage camera tag folders.
- Switch Tenant — Switch between service provider tenants if you manage multiple.