Admin Guide
What the Admin Guide Covers
The GCXONE dashboard is the central hub for monitoring your security infrastructure. When you log in, the dashboard immediately surfaces the most operationally relevant information: alarm volumes, site health, and camera status.
Why It Matters
The dashboard gives administrators immediate visibility into alarm volumes, site health, and camera status the moment they log in — without navigating through multiple screens.
How It Works
Dashboard KPI Cards
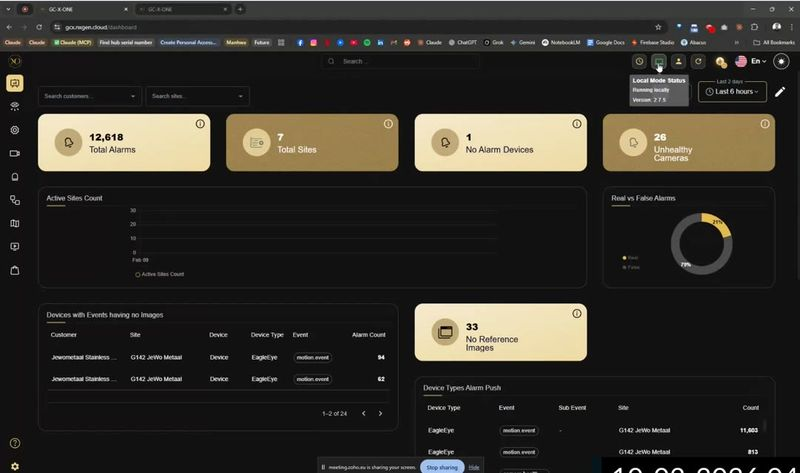
Four KPI cards appear across the top of the dashboard. Each card covers a critical metric for the time range selected (default: Last 2 days, adjustable).
- Total Alarms — the total number of alarm events generated across all monitored sites.
- Total Sites — the count of sites currently configured under your service provider account.
- No Alarm Devices — devices that are active but have not generated any alarms in the selected period. High counts here may indicate connectivity or sensor issues.
- Unhealthy Cameras — cameras that failed their most recent HealthCheck. This count links directly to the HealthCheck module.
Dashboard Charts
Below the KPI cards, the dashboard displays four charts:
- Active Sites Count — A line chart showing how many sites were actively streaming or reporting alarms over the selected period.
- Real vs False Alarms — A donut chart showing the ratio of verified real alarms to false positives filtered by the platform. In a typical deployment, 75–80% of events are automatically filtered as false.
- Devices with Events Having no Images — A table listing devices that triggered events but failed to attach an image. This points to cameras that need reference image calibration or streaming configuration review.
- Device Types Alarm Push — A breakdown of alarm volume by device type and event type, useful for identifying which integrations are generating the most noise.
Left Navigation Sidebar
The sidebar provides access to all major platform modules. The icons from top to bottom are:
- Dashboard — the KPI overview page.
- Alarms — the alarm event queue and Talos workflow management.
- Sites — site-level overview and health status.
- Device Explorer — live video viewer with hierarchical site/camera tree.
- Map — satellite map view with camera and sensor placement.
- Reports — HealthCheck and other reporting modules.
- Configuration — admin settings for customers, sites, devices, sensors.
- Settings (gear icon, bottom) — roles, users, tags, and account settings.
Top Bar Controls
- Search — global search across all entities (sites, devices, sensors). Results show breadcrumb paths and quick-action buttons.
- Local Mode Status indicator — shows whether you are running cloud mode or local fallback, and the client version.
- Date range filter — adjusts the time window for all dashboard metrics.
- Language selector — switches the UI language.
- User profile / notifications icon.
Key Capabilities
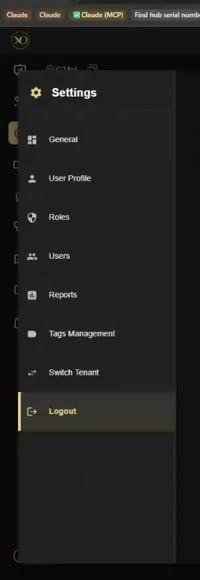
Navigating to Settings
To access administrative settings, click the gear icon at the bottom of the left navigation sidebar. From Settings you can manage:
- General — organisation-level preferences.
- User Profile — your own account details.
- Roles — define and configure role-based access.
- Users — invite and manage user accounts.
- Reports — scheduled and on-demand report settings.
- Tags Management — manage camera tag folders.
- Switch Tenant — move between service provider tenants if you manage multiple.
Real-World Use Cases
- An admin logs in at the start of the shift and checks the four KPI cards — spots an elevated Unhealthy Cameras count and opens the HealthCheck module immediately.
- A service provider managing multiple tenants uses Switch Tenant to move between client environments without logging out.
- An operator uses the global Search (Ctrl+K) to locate a specific site within seconds instead of navigating manually.
- An admin adjusts the Date range filter to the last 7 days to review alarm trends before a monthly customer review.
Best Practices
- Check all four KPI cards at the start of every shift — any non-zero Unhealthy Cameras count needs immediate investigation.
- Use the Date range filter consistently — always align it to your reporting period before reviewing metrics.
- Use global Search for fast entity lookup rather than navigating manually through the sidebar.
- Keep Settings organised — review Roles and Users regularly to ensure access remains accurate as teams change.