Dashboard
What Dashboard Does
The Dashboard provides a real-time system overview of your security environment. It displays key metrics through customizable widgets that give operators and administrators instant visibility into alarms, sites, cameras, and performance data — all from a single view.
Why It Matters
Operators need to quickly assess the health of their entire security environment without navigating through multiple pages. The Dashboard consolidates the most critical metrics into one configurable view, enabling faster decision-making and proactive monitoring.
How It Works
The Dashboard is accessible from the main navigation in GCXONE. It displays widgets showing real-time data that updates automatically based on the selected time range. The layout is fully customizable — administrators can add, move, and remove widgets to match their operational priorities.
The Dashboard is available at multiple hierarchy levels — including Service Provider, Customer, Site, Device, and Sensor — each showing data scoped to that level.
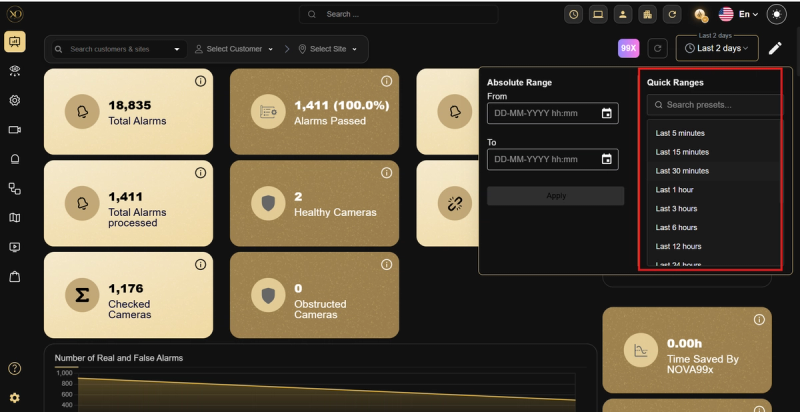
Time Range Filter
The Dashboard includes a time range selector in the top right corner. Selecting a time range instantly updates all widgets to reflect data for that specific period. Available options include Last Shift, Last 2 Days, and custom ranges.
Dashboard Levels
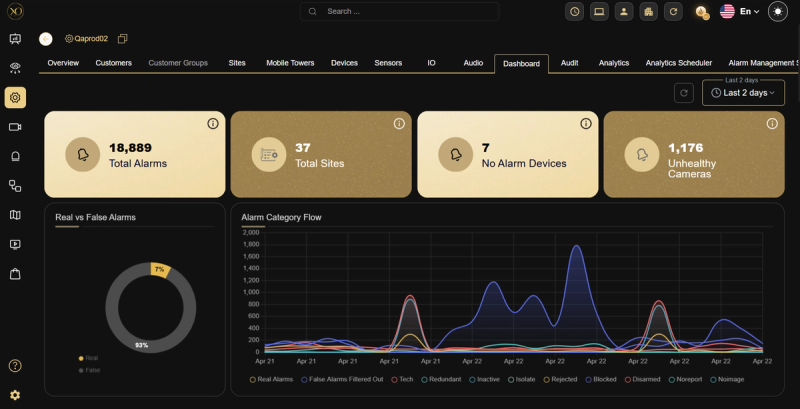
Service Provider Level
Shows a complete overview across all customers and sites in the tenant, including:
- Total Alarms
- Total Sites
- No Alarm Devices
- Unhealthy Cameras
- Real vs False Alarms
- Alarm Category Flow
- Alarm Flow by Customer
- Alarm Flow at Site Level
- Device Types Alarm Push
- Devices with Slow Alarm Reception
- Blocked Alarms due to Overflow
- Site Level Alarm Category Count
- Video Alarms Count
- Technical Alarms Count
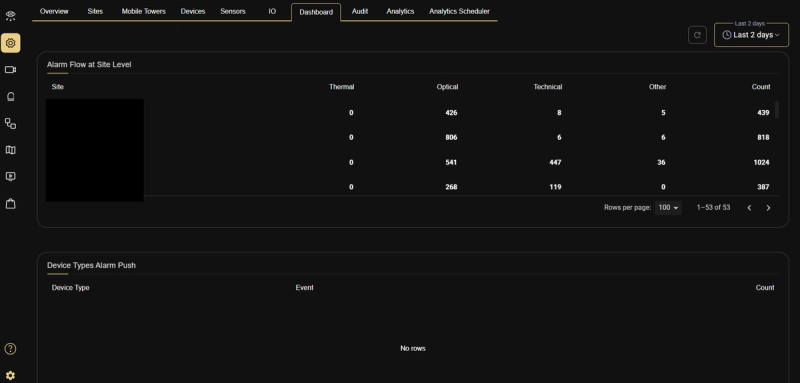
Customer Level
Shows data scoped to a specific customer, including:
- Alarm Flow at Site Level — breakdown of alarms per site showing Thermal, Optical, Technical, Other, and total Count
- Device Types Alarm Push — breakdown of alarm events by device type
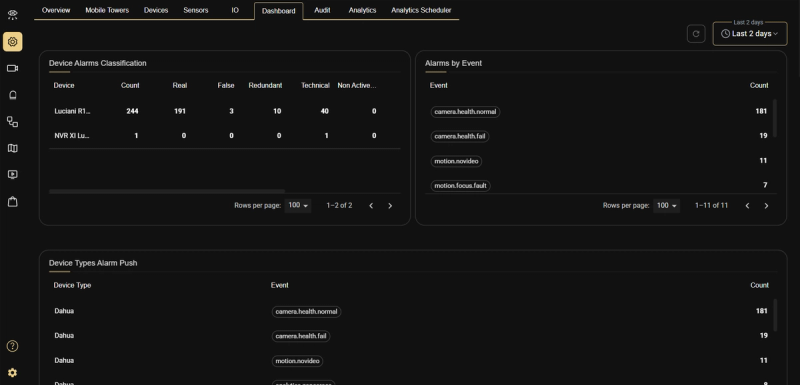
Site Level
Shows data scoped to a specific site, including:
- Device Alarms Classification — a table showing per-device breakdown of alarm counts: Real, False, Redundant, Technical, and Non Active
- Alarms by Event — a table listing event types and their counts
- Device Types Alarm Push — a table showing Device Type, Event, and Count
Device Level
Shows data scoped to a specific device, including:
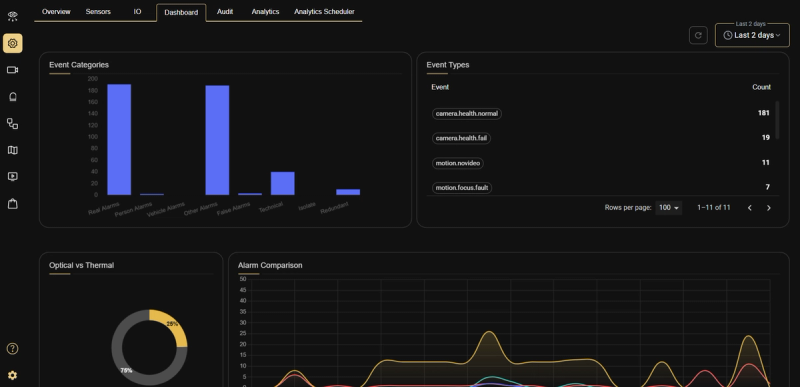
- Event Categories — a bar chart displaying alarm categories: Real Alarms, Person Alarms, Vehicle Alarms, Other Alarms, False Alarms, Technical, Isolate, and Redundant
- Event Types — a table listing event types and their counts
- Optical vs Thermal — a donut chart showing the ratio between optical and thermal alarms
- Alarm Comparison — a line chart comparing alarm types over time
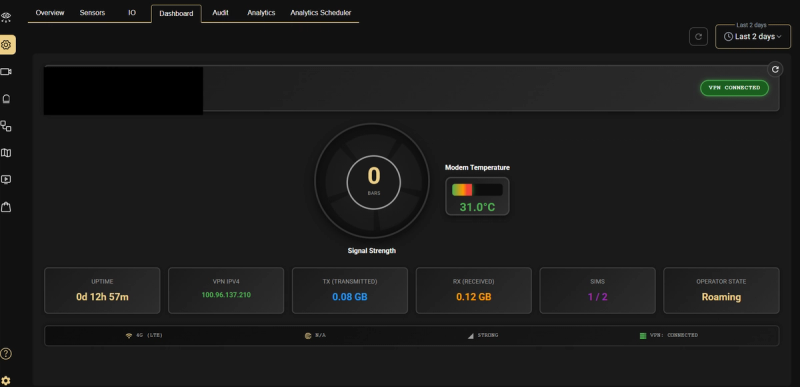
Note: Certain device types — such as Teltonika, Victron, and EFOY Fuel Cell — display a specialized Dashboard tailored to their technical nature. For example, the Teltonika device Dashboard shows connectivity and hardware metrics including Signal Strength, Modem Temperature, Uptime, VPN IPV4, TX/RX data, SIM status, and Operator State, instead of the standard alarm-based widgets.
Sensor Level
Shows data scoped to a specific sensor, including:
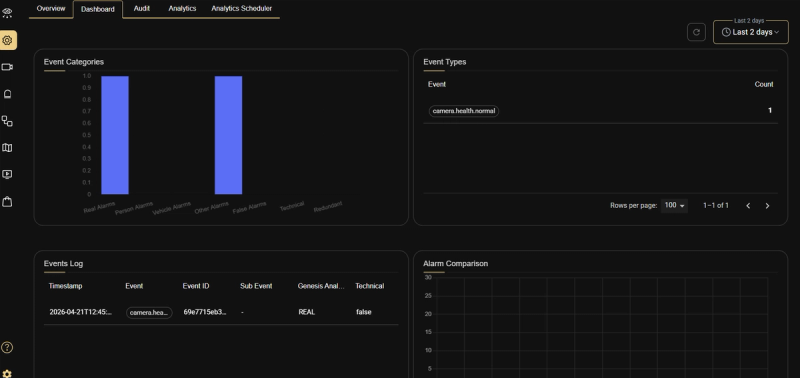
- Event Categories — a bar chart displaying: Real Alarms, Person Alarms, Vehicle Alarms, Other Alarms, False Alarms, Technical, and Redundant
- Event Types — a table listing event types and their counts
- Events Log — a detailed log table showing: Timestamp, Event, Event ID, Sub Event, Genesis Analysis, and Technical classification
- Alarm Comparison — a line chart comparing alarm types over time
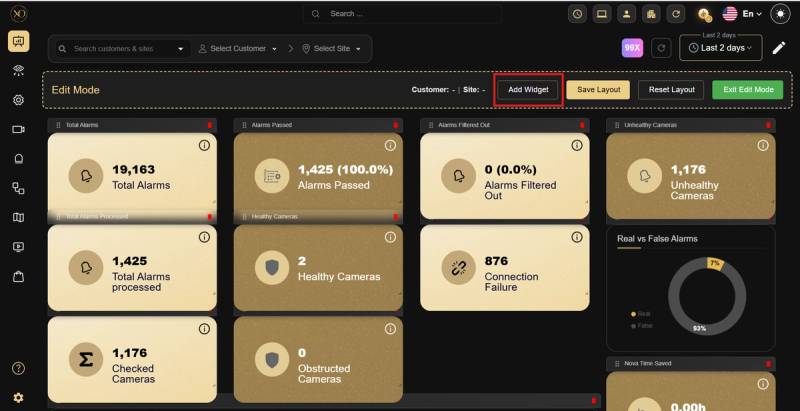
Customization — Edit Mode
Administrators can customize the Dashboard layout using Edit Mode:
-
Click Edit Mode to enter customization
-
Use the filter options to scope widgets by Customer or Site
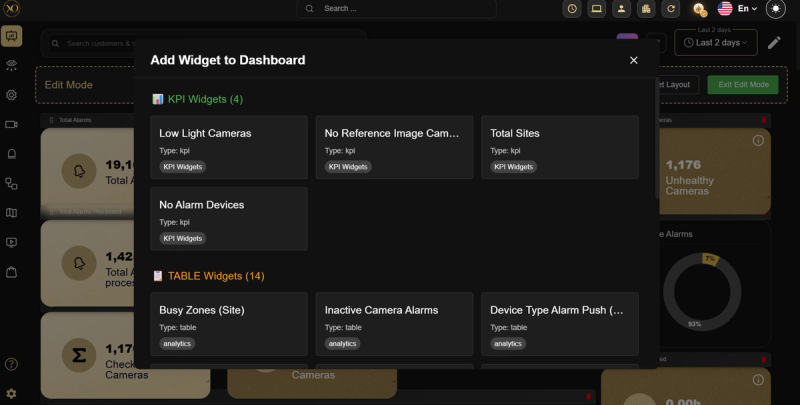
-
Click Add Widget to add new widgets to the dashboard
-
Drag widgets to reposition them
-
Click Save Layout to preserve the customized structure for future use
-
Click Reset Layout to restore the default layout
-
Click Exit Edit Mode when done
Related Resources
- For alarm management, refer to Alarm Management System
- For Nova99x AI automation, refer to Nova99x
- For contacting support, refer to Contact Support